


Based on quarterly trends and information from various sources, Statistic Mauritius has worked out its forecast for the External Merchandise Trade Sector. Total exports for 2016 are forecasted at around Rs 95,000 million and imports at Rs 171,000 million. Trade deficit for 2016 is therefore expected to be around Rs 76,000 million.
Publicité
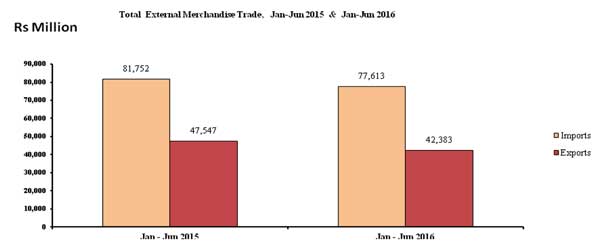
Total external merchandise trade for the second quarter of 2016 was valued at Rs 61,405 million, i.e. 4.8% higher than the previous quarter but 9.6% lower compared to the corresponding quarter of 2015. During the second quarter of 2016, total exports (including ship’s stores & bunkers) were valued at Rs 21,225 million against imports of Rs 40,180 million. The resulting trade deficit worked out to Rs 18,955 million, 16.5% higher than the deficit of Rs 16,275 million of the previous quarter and 6.5% higher than the deficit of 17,790 million of the corresponding quarter of 2015.
Exports
Total export proceeds for the second quarter of 2016, including domestic exports, re-exports and ship’s stores and bunkers, amounted to Rs 21,225 million, showing a slight increase of 0.3% compared to the previous quarter. This is mainly explained by increases in the exports of “Manufactured goods classified by material” (+18.0%) and “Miscellaneous manufactured goods” (+3.5%), partly offset by decreases in exports of “Machinery and transport equipment” (-29.2%) and “Ships’ stores & bunkers” (-10.0%). Compared to the corresponding quarter of 2015, total exports for the second quarter of 2016 dropped by 15.3%. This is mainly explained by decreases in “Machinery and transport equipment” (-65.6%) and “Ship’s stores & bunkers” (-37.2%), partly offset by increases in “Beverages & tobacco” (+37.8%) and “Food and live animals” (+5.6%).
Country of destination
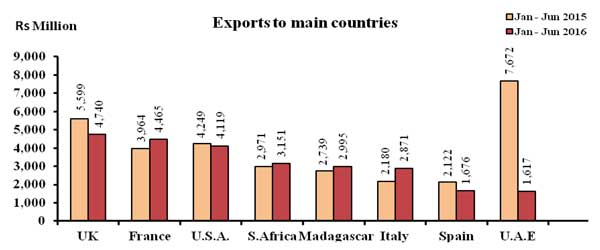
Analysis of exports figures by country of destination for the first semester of 2016 shows that the European countries were our main buyers, purchasing some 47.0% of our exports for a value of Rs 18,563 million. The major destinations for our exports were U.K (12.0%), France (11.3%), U.S.A (10.4%), South Africa (8.0%), Madagascar (7.6%), Italy (7.3%), and Spain (4.2%). Compared to the corresponding period of 2015, total exports to UAE went down by 78.9%, mainly explained by a decrease in re-exports of “Telecommunication equipment and accessories”. Exports to Italy, France, Madagascar and South Africa went up by 31.7%, 12.6%, 9.3% and 6.1% respectively. On the other hand, exports to Spain, UK and USA fell by 21.0%, 15.3% and 3.1% respectively.
Imports
Total imports for the second quarter of 2016 amounted to Rs 40,180 million, showing an increase of 7.3% over the previous quarter. This is mainly due to increases in imports of “Miscellaneous manufactured articles” (+33.5%), “Chemicals & related products” (+18.4%), “Mineral fuels, lubricants and related products” (+10.0%), “Manufactured goods classified chiefly by materials” (+9.4%), partly offset by a decrease in imports of “Machinery and transport equipment” (-1.5%).
Compared to the corresponding quarter of 2015, imports in the second quarter of 2016 fell by 6.2%. This decline is mainly the result of decreases in imports of “Mineral fuels, lubricants and related products” (-26.5%), “Manufactured goods classified chiefly by materials” (-17.4%) and “Machinery and transport equipment” (-8.6%), partly offset by increases in the imports of “Miscellaneous manufactured articles” (+14.9%), “Chemicals & related products” (+7.0%) and “Food and live animals” (+6.1%).
Around 25.9% of imports in the first semester of 2016 consisted of “Machinery and transport equipment” (Rs 20,084 million), 20.7% of “Food and live animals” (Rs 16,032 million), 16.2% of “Manufactured goods classified chiefly by materials” (Rs 12,566 million) and 12.6% of “Mineral fuels, lubricants and related materials” (Rs 9,811 million).
Country of origin
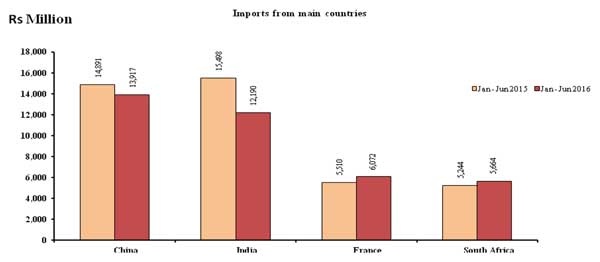
Almost half of our imports originated from four main countries, namely: China (17.9%), India (15.7%), France (7.8%) and South Africa (7.3%). Among continents, Asia was our main supplier with a share of Rs 40,664 million, representing 52.4% of total imports. Compared to the corresponding semester of 2015, total imports from India and China fell by 21.3% and 6.5% respectively while those from France and South Africa rose by 10.2% and 8.0% respectively.
Trade in Freeport Zone
During the first six months of 2016, total imports of the Freeport Zone stood at Rs 8,131 million, lower by 34.9% compared to corresponding period of 2015. Re-exports were valued at Rs 8,136 million, representing a decrease of 35.4% over the first semester of 2015. The main items imported and re-exported were “Fish and fish preparations” and “Telecommunications equipment & accessories”.

Notre service WhatsApp. Vous êtes témoins d`un événement d`actualité ou d`une scène insolite? Envoyez-nous vos photos ou vidéos sur le 5 259 82 00 !


![[Info Soirée] : « bizin pa negliz bann slow learners »](https://defimedia.info/sites/default/files/styles/square_thumbnail/public/thumbnail_190425.jpg?itok=J--MzK_k)